


Left Ventricle
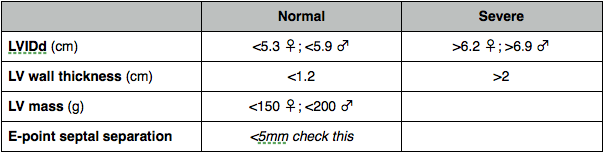
LV dimensions
Measure in M-mode or 2D if not at 900 usually in PLAX. End systole and end diastole.
End diastole either onset of QRS or frame after MV closure.
End systole either mid T wave or LVID narrowest or frame preceding MV opening.
LV volume
Simpsons.
Area-length. PSAX end diastole planimetry papillary level (ignoring papillary muscles). Measure length LV in A4C.
LVEDV = 5 x area x length / 6
LV mass
Linear
- Dimensions septum, LV and posterior wall in diastole in PLAX. Equation for mass.
- Area-length. Planimetry of endocardial and epicardial borders in PSAX. Length of LV in A4C. Equation.
- Simpsons. Epicardial - endocardial trace = endocardial volume. Times this by 1.05g/ml for mass.
Systolic function
Fractional shortening
% change in LV dimensions
Worked out from dimension measurements
(LVIDd – LVIDs / LVIDd) x 100
Fractional area change
Trace endocardial border at papillary level in PSAX in systole and diastole
(LVAd - LVAs) / LVAd x 100
EF
% of blood pumped out (volumetric most accurate - Simpsons better than area-length, also derived from linear measurements).
Foreshortening will overestimate EF.
LVEDV – LVESV / LVEDV x 100
MAPSE
Longitudinal function accounts for around 30% of hearts power but if reduced will leave EF unaffected. MAPSE should be >12 mm.
Stroke distance
Average distance travelled by blood during each heartbeat.
Measured by VTI of LVOT. PW at or just proximal to level of annulus. Trace around Doppler signal below line (forward flow) to get VTI.
Normal (cm) 18-22
SV
Quantity of blood ejected from LV into aorta with each heartbeat.
Measure LVOT at the same point VTI measured. Machine will automatically calculate X-sectional area - 0.75 x (LVOT diameter)2
SV = CSA LVOT x VTI LVOT
dP/dt
Pressure change divided by time change.
CW trace of MR in A4C.
High sweep speed to spread out trace.
Mark points where regurgitation velocity 1m/s and 3m/s and measure the time interval between these.
At 1m/s the pressure gradient will be 4mmHg (Bernoulli - gradient = 4 x V2). At 3m/s the gradient will be 36. Change in gradient is therefore 36 - 4 = 32. dP/dt in mmHg/s is therefore:
32 / time interval (s)
Misleading if acute MR or increased afterload (AS or hypertension)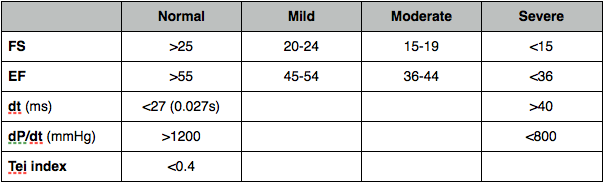
Diastolic function
Pasted Graphic
LV inflow
PW at tips of MV in A4C. Measure:
- Peak E velocity
- E deceleration time
- Peak A velocity
- E:A ratio
- IVRT – time between AV closure and MV opening. PW between MV and AV in A5C. Measure between end of aortic outflow trace and start of mitral inflow trace
Mitral inflow is normally greatest in early diastole when the MV opens and flow occurs due to the AV pressure gradient. This creates the E wave (plot of velocity of all the red cells by time).
As late diastolic atrial contraction contributes only 30% of LV inflow the A wave generated is smaller than the E wave (the velocity profile is smaller). The E/A ratio is therefore >1 (normal is 1-2).
As LV relaxation and compliance become impaired the LVEDP rises, thus reducing the transmitral pressure gradient, and flow slows down in early diastole. The E wave becomes smaller and the deceleration time is prolonged as the LV relaxes and fills more slowly, reducing early diastolic filling. The impaired relaxation of the LV also increases the IVRT prior to MV opening. The atrial contribution to LV filling is increased as the reduced flow in early diastole means there is more blood left in the LA for it to squirt into the LV. So while the E wave reduces the A wave increases and the E/A ratio is now becomes <1.
As diastolic dysfunction worsens, LA pressure progressively rises to try and maintain the transmitral pressure gradient and LV filling. This means the E wave progressively increases, first of all restoring a normal E/A ratio (pseudo-normalisation) and then ending up with an E/A ratio of >2. The E deceleration time and IVRT also shorten, pseudo-normalising before becoming abnormally shortened.
Pseudo-normalisation means that the only way of distinguishing moderate DD from normal (looking at MV inflow alone) is to alter the loading conditions of the heart (a valsalva is one way to do this - if DD is present this manoeuvre will convert the doppler signal to one of mild DD whereas there will be no change with normal diastolic function).
The compliant LA will be enlarged with increased LV pressures so a dilated LA is also suggestive of a ‘normal’ trace being one that is pseudo-normal. The LA will also be seen bulging into the RA with elevated LA pressure. Other doppler parameters such as pulmonary venous flow and tissue doppler of the MV annulus should be looked at to confirm DD. See below. The single best measurement is E/Em ratio at the lateral MV annulus. Hamlin et al. Role of diastole in left ventricular function, II: diagnosis and treatment. Am J Crit Care 2004; 13: 453–66
Pulmonary venous flow
PW in pulm vein in A4C
- Peak S – systolic velocity
- Peak D – diastolic velocity
- Peak A – atrial reversal
TDI of mitral annulus
Tissue Doppler with low gain and aliasing velocity of 15-20cm/s
PW the endocardium at, or up to 1cm below (towards apex), MV annulus at lateral wall +/- septum.
Get an Em (early myocardial velocity) which corresponds to early diastolic relaxation with myocardium moving away from transducer. Further movement away from transducer with atrial contraction Am. Normally Em > Am with reversal of this increasing with increasing dysfunction. (As LV gets stiffer and LVEDP rises the wall moves (relaxes) less while atrial pressure increases in response to increased LVEDP). Similar to E and A at MV tips which corresponds to flow rather than wall motion. E to Em ratio reflects LA pressure.
MV inflow is pre-load dependent; PW TDI pre-load independent.
Colour M-mode of early LV inflow.
Not necessary for the exam
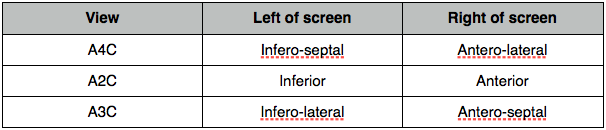
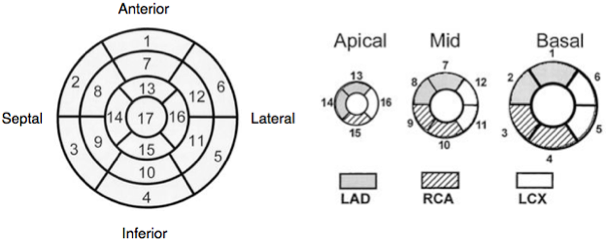
Regional wall motion and coronary arteries
Normal wall motion in systole is endocardial excursion of >5mm and wall thickening of >50%.
- Normokinetic
- Hypokinetic
- Akinetic
- Dyskinetic
- Aneurysmal
Wall thickening better than endocardial movement as an akinetic segment may be moved because it is attached to another moving part.
Critical care implications
see Critical Care Echo